Since this is the 20th anniversary of Matt’s original CRAN submission, I wanted to do some analysis of contributors over time, to emphasize the great community that has been working to improve data.table in recent years.
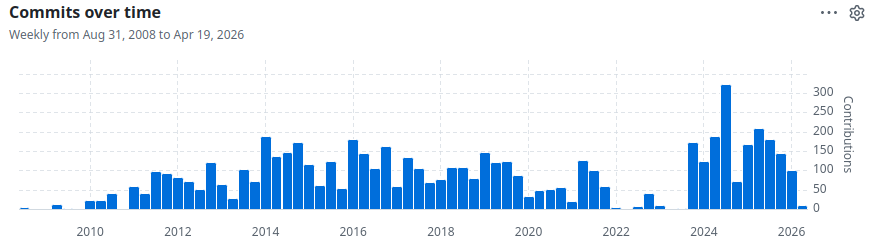
To do that, a simple way is to look at the commit history on GitHub:
github data table commits
Above we can see that there is a record number of commits since late 2023, which is when the formal project governance was adopted. That was a turning point in the package’s history. Prior to that, Matt Dowle was reviewing and merging all PRs. Matt did a fantastic job ensuring quality and performance, but it was difficult to handle the sheer volume of issues and PRs, since data.table is so widely used in the R community (1700+ other CRAN packages list data.table as a hard dependency as of April 2026). Now, there is a group of several committers, including myself, that can review and merge PRs. So it is much easier to handle the increased number of contributions from the much larger group of people that are now using data.table. If you are using data.table, please consider contributing! We are an open and diverse group, and there are lots of ways to contribute:
writing a tutorial about data.table on your blog.
look at the list of open issues on GitHub, try to reproduce the issue on your machine, and add a comment to the issue that explains if the issue is still happening on your machine (or not).
sending us a new issue,
if you think there may be a problem that could be fixed.
if you have an important use case for which we could possibly add new tests (for validity of output, or for performance using atime).
anything else! We primary use issues to communicate, so please do not hesitate to open a new issue.
write a PR with a
vignette translation, currently available in en, es, fr, ru.
fix for an existing issue.
When the PR is merged, you will be invited to become a Project Member, meaning you will have permission to create new branches in the central data.table repo.
Volunteer to become a Reviewer for the R or C code files in data.table that are important to you! You will be notified when there is a PR with modifications, and you can comment to ask for improvements to the PR.
Eventually after contributing and reviewing several PRs, you can be invited to become a Committer, with permission to merge PRs into the master branch.
Now is a great time to get involved. Your contributions to data.table will be greatly appreciated by the community around data.table, including the wider community of other packages that depend on data.table for its state-of-the-art efficiency.
New analysis of CRAN authors and contributors
In the rest of this article, my goal is to analyze the number of authors and contributors in CRAN releases of data.table. We first download data on all releases, using code from my previous post about the release history of data.table.
Download Archive web page
We can download the Archive web page for data.table via the code below. Note that In R ≥ 4.5, tools::CRAN_archive_db() can be used, but here we use download.file() to give an example of how HTML can be parsed into a data table using library(nc), one of my packages with strong data.table integration, which was recently granted a Seal of Approval!
The output above shows that the Archive web page has a regular structure, which we can convert into a data table using the regular expression pattern below.
file=file.pattern which means to apply the previous regex, and put the matching text in the file column,
"</a>" which matches the closing </a> tag
"\\s+" which matches one or more white space characters,
IDate=".*?", as.IDate, which matches zero or more characters (non-greedy, as few as possible), then uses as.IDate to convert the text to efficient integer date, saved in the IDate column,
"\\s" means to match one white space character.
The end result is a table with one row for each matched package version, and one column for each of the named arguments:
Above the table shows all matches, in the same order as the original Archive web page. Below we key the table by date, which sorts the data in place (without allocating any new memory), and enables fast joins.
The code above sets the key of the grid, which sorts and enables fast joins. No variables were specified to setkey(); the default is to use all columns, in this case just one. Note that setkey() sets the key by reference, then returns the table.
Next, we do a rolling join to find which releases are nearest to each date in the grid.
The output above shows one row per release we will analyze. For each release, we download the package sources from the Archive, and extract the Author field of DESCRIPTION.
     version    release                              Author                       no.newlines
      <char>     <IDat>                              <char>                            <char>
 1:      1.0 2006-04-14                          Matt Dowle                        Matt Dowle
 2:      1.6 2011-04-24   Matthew Dowle with many contri... Matthew Dowle with many contri...
 3:    1.9.6 2015-09-19   M Dowle, A Srinivasan, T Short... M Dowle, A Srinivasan, T Short...
 4:   1.10.4 2017-02-01 Matt Dowle [aut, cre],\nArun Sri... Matt Dowle [aut, cre], Arun Sr...
 5:   1.11.0 2018-05-01 Matt Dowle [aut, cre],\nArun Sri... Matt Dowle [aut, cre], Arun Sr...
 6:   1.12.2 2019-04-07 Matt Dowle [aut, cre],\nArun Sri... Matt Dowle [aut, cre], Arun Sr...
 7:   1.13.0 2020-07-24 Matt Dowle [aut, cre],\nArun Sri... Matt Dowle [aut, cre], Arun Sr...
 8:   1.14.0 2021-02-21 Matt Dowle [aut, cre],\nArun Sri... Matt Dowle [aut, cre], Arun Sr...
 9:   1.14.4 2022-10-17 Matt Dowle [aut, cre],\nArun Sri... Matt Dowle [aut, cre], Arun Sr...
10:   1.14.8 2023-02-17 Matt Dowle [aut, cre],\nArun Sri... Matt Dowle [aut, cre], Arun Sr...
11:   1.15.4 2024-03-30 Tyson Barrett [aut, cre],\nMatt ... Tyson Barrett [aut, cre], Matt...
12:   1.17.2 2025-05-12   Tyson Barrett [aut, cre] (ORCI... Tyson Barrett [aut, cre] (ORCI...
13: 1.18.2.1 2026-01-27   Tyson Barrett [aut, cre] (ORCI... Tyson Barrett [aut, cre] (ORCI...
The output above has a new column of comma-separated authors per release (with no newlines). We would like to convert these data to a table with one year per author. A simple approach would be
[[1]]
[1] "Matt Dowle"

[[2]]
[1] "Matthew Dowle with many contributions from Tom Short.  See SVN logs on R-Forge."

[[3]]
[1] "M Dowle"                                       "A Srinivasan"
[3] "T Short"                                       "S Lianoglou with contributions from R Saporta"
[5] "E Antonyan"

[[4]]
[1] "Matt Dowle [aut"       "cre]"                  "Arun Srinivasan [aut]" "Jan Gorecki [ctb]"
[5] "Tom Short [ctb]"       "Steve Lianoglou [ctb]"

[[5]]
[1] "Matt Dowle [aut"       "cre]"                  "Arun Srinivasan [aut]" "Jan Gorecki [ctb]"
[5] "Michael Chirico [ctb]" "Pasha Stetsenko [ctb]"

[[6]]
[1] "Matt Dowle [aut"       "cre]"                  "Arun Srinivasan [aut]" "Jan Gorecki [ctb]"
[5] "Michael Chirico [ctb]" "Pasha Stetsenko [ctb]"
It is clear that the result above does not quite work (Matt’s aut, cre role contains a comma so is broken into two entries). Instead we can use the regular expression below.
author.pattern <-list(name=".+?", nc::quantifier(" \\[",roles=".+?","\\]","?"), nc::quantifier(" \\(", paren=".+?","\\)","?"),## each author ends with one of these (\z means end of string). nc::alternatives(" with (?:many )?contributions from ", ", ", "\\z"))(author.dt <- desc.dt[, nc::capture_all_str( no.newlines, author.pattern), by=.(version, release)])
      version    release                              name  roles       paren
       <char>     <IDat>                            <char> <char>      <char>
  1:      1.0 2006-04-14                        Matt Dowle
  2:      1.6 2011-04-24                     Matthew Dowle
  3:      1.6 2011-04-24 Tom Short.  See SVN logs on R-...
  4:    1.9.6 2015-09-19                           M Dowle
  5:    1.9.6 2015-09-19                      A Srinivasan
 ---
551: 1.18.2.1 2026-01-27                        @badasahog    ctb GitHub user
552: 1.18.2.1 2026-01-27                      Vinit Thakur    ctb
553: 1.18.2.1 2026-01-27                       Mukul Kumar    ctb
554: 1.18.2.1 2026-01-27                    Ildikó Czeller    ctb
555: 1.18.2.1 2026-01-27                       Manmita Das    ctb
The table above has one row for each time a person appears in the Author field of one of the releases. We will analyze the roles.
author.dt[roles==""]
   version    release                              name  roles  paren
    <char>     <IDat>                            <char> <char> <char>
1:     1.0 2006-04-14                        Matt Dowle
2:     1.6 2011-04-24                     Matthew Dowle
3:     1.6 2011-04-24 Tom Short.  See SVN logs on R-...
4:   1.9.6 2015-09-19                           M Dowle
5:   1.9.6 2015-09-19                      A Srinivasan
6:   1.9.6 2015-09-19                           T Short
7:   1.9.6 2015-09-19                       S Lianoglou
8:   1.9.6 2015-09-19                         R Saporta
9:   1.9.6 2015-09-19                        E Antonyan
We see some old entries above with missing roles, which we fill in below.
          Role
roles      ctb aut <NA>
             5   4    0
  aut        0  26    0
  aut, cre   0  10    0
  ctb      510   0    0
  <NA>       0   0    0
Above we use fcase() to create a new Role column, with factor levels in a non-default order (to control legend entry display order below). Then we chain square brackets to display a table which shows how roles are mapped to Role. The counts look reasonable, so the next step is to count how many people with each role in each release:
       release  version   Role people
        <IDat>   <char> <fctr>  <int>
 1: 2006-04-14      1.0    aut      1
 2: 2011-04-24      1.6    aut      1
 3: 2011-04-24      1.6    ctb      1
 4: 2015-09-19    1.9.6    aut      2
 5: 2015-09-19    1.9.6    ctb      4
---
21: 2024-03-30   1.15.4    ctb     65
22: 2025-05-12   1.17.2    aut      8
23: 2025-05-12   1.17.2    ctb     81
24: 2026-01-27 1.18.2.1    aut      8
25: 2026-01-27 1.18.2.1    ctb     87
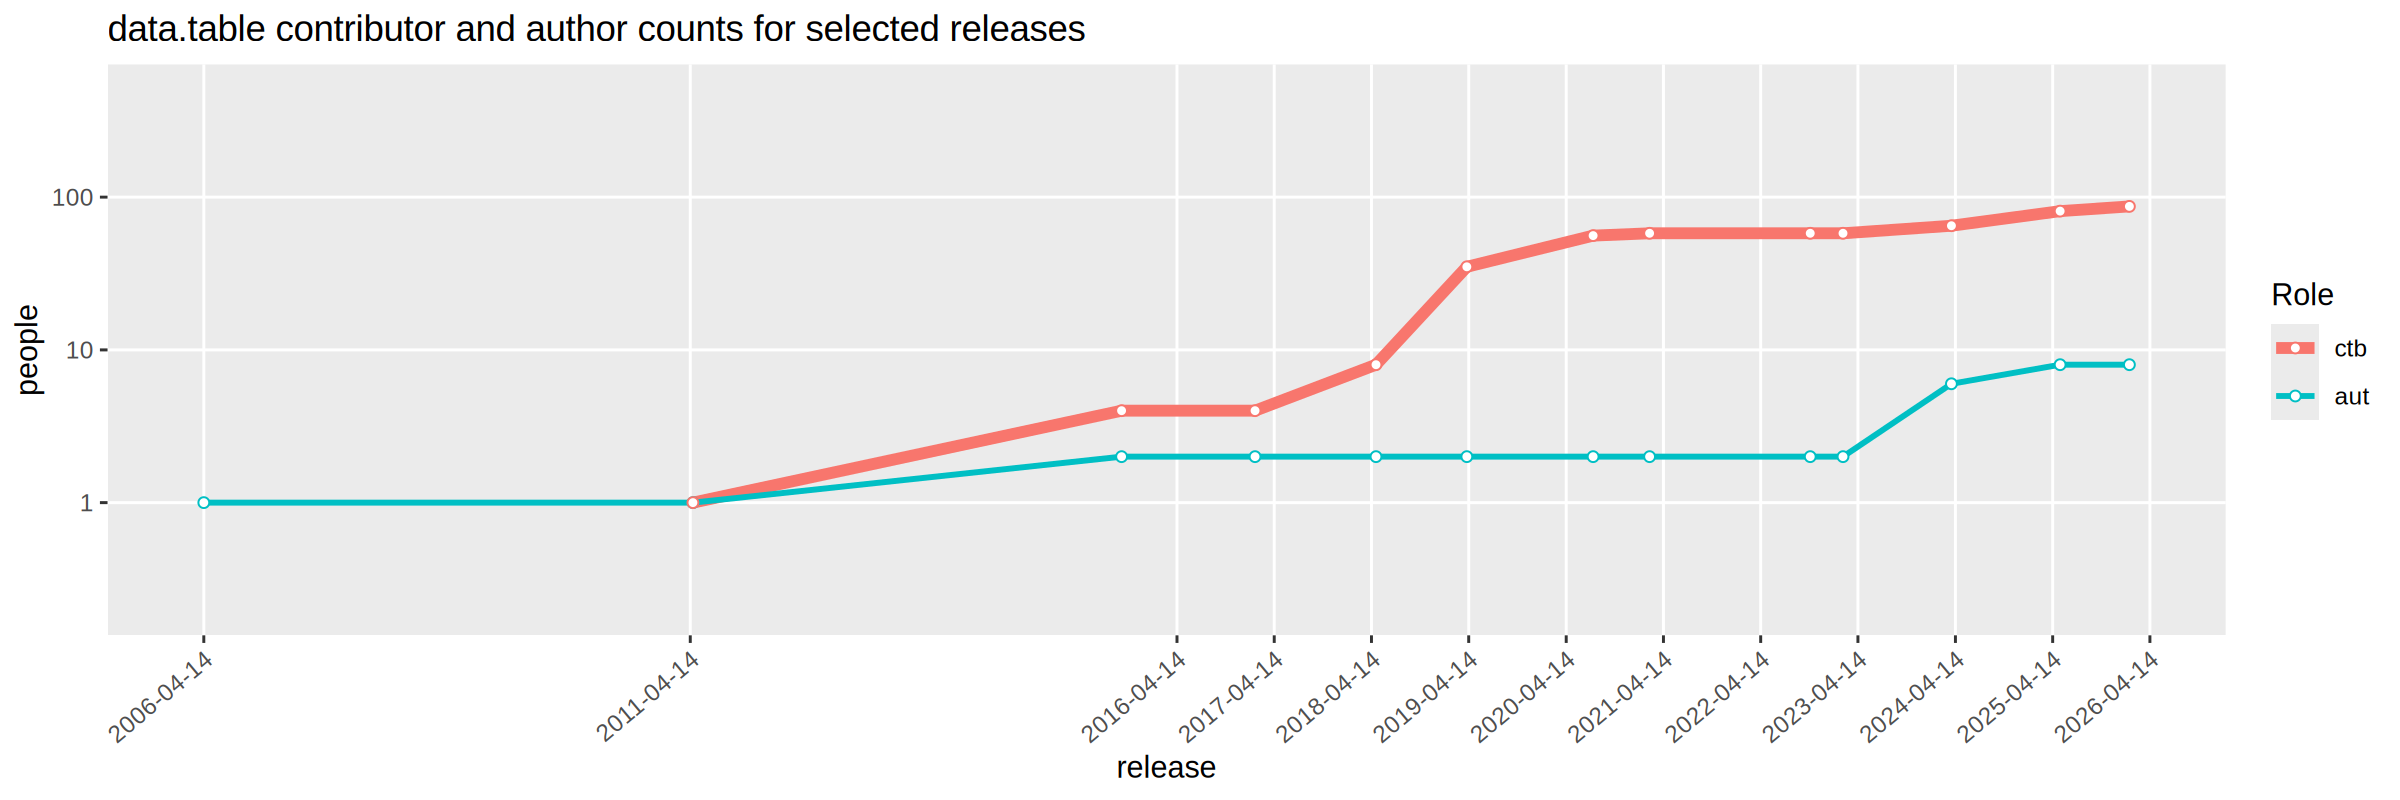
How has this evolved in the past ten years?
library(ggplot2)(gg <-ggplot(count.dt, aes( release, people, color=Role))+ggtitle("data.table contributor and author counts for selected releases")+theme(panel.grid.minor=element_blank(),axis.text.x=element_text(hjust=1, angle=40))+geom_line(aes(linewidth=Role))+geom_point(shape=21, fill="white")+scale_x_date(breaks=grid.dt$grid.IDate)+scale_linewidth_manual(values=linewidth.values)+scale_y_log10(limits=c(0.2, 500)))
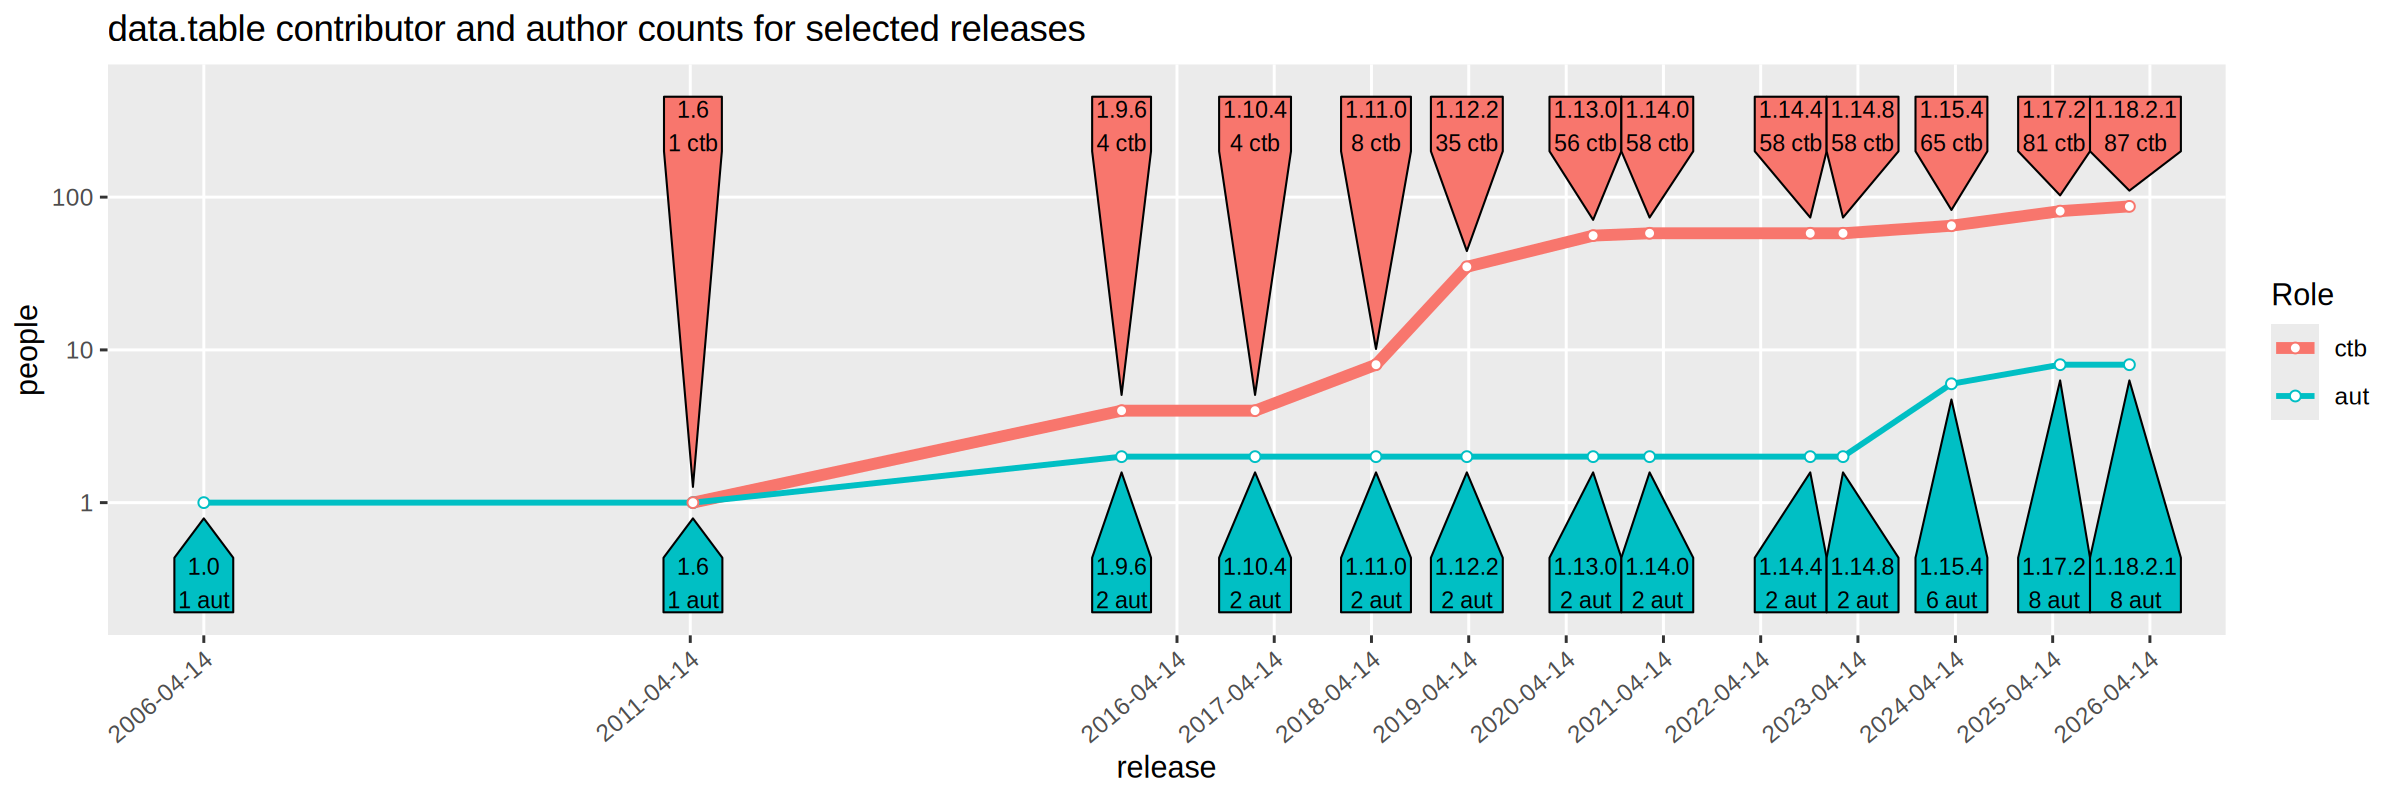
Above we see a time series showing the increasing authors and contributors over time. To emphasize the values at each release, we add direct labels below:
geom_dl_poly <-function(role, position, direction)directlabels::geom_dl(aes(label=sprintf("%s\n%s %s", version, people, Role)),data=count.dt[Role==role],method=list(cex=0.7, # text size of direct labels. directlabels::dl.add(y=direction*0.2),# cm between polygon point and data point. directlabels::polygon.method( position, offset.cm=0.5))) #space between polygon point and text.(dl <- gg+geom_dl_poly("ctb", "top", 1)+geom_dl_poly("aut", "bottom", -1))
The figure above shows that the number of authors and contributors has greatly expanded in the second decade of data.table. I would especially like to thank the other new Committers since adoption of the formal governance. Jan Gorecki, Mike Chirico, Ben Schwendinger, Tyson Barrett, and Ivan Krylov have been doing most of the work, writing, reviewing and merging PRs, that is keeping data.table a relevant and state-of-the-art package for data science. Another special thank you goes out to Kelly Bodwin, who lead the effort to get data.table accepted as a NumFOCUS affiliated project (since 2025). I’m looking forward to the third decade!
Conclusion
We have shown how to download CRAN package release data, how to parse the web pages using the nc package and regular expressions, how to summarize/analyze using data.table, and how to visualize using ggplot2. If you are using data.table, please consider contributing! We are an open and inclusive group that appreciates new contributions!